Optimize the management of your logistical flows, carry out investment and/or performance studies, simulate the impact of reorganization and resizing of your network.
Optimization of flows and transportation plan.
The Artelys Crystal Network Designer helps you optimize all your flows in accordance with your own economic, environmental and service quality objectives. The model also optimizes for each transport type the replenishment frequency, the quantities transported and consequently the impact on safety stocks.
Network design.
By using optimization techniques to solve highly combinatorial problems, Artelys Crystal Network Designer allows you to design the best network.
The software is capable of determining the best (re)locations of factories, platforms and armaments, as well as their characteristics (for example, armament capacity).
Dimensioning of the supply chain.
The Artelys Crystal Network Designer allows you to create and compare different scenarios “by yourself”: increasing the capacity of a production line, increasing the storage capacity of a weapon, etc. The impact of these changes on the entire supply chain is automatically evaluated, allowing you to support your decisions.
Analysis of the robustness of the environment.
The operational risks can be automatically generated and simulated in order to quantify the robustness of the supply chain, its adaptability and the associated financial risks.
The Artelys Crystal Network Designer makes it easy to analyze two risks related to just-in-time logistics management and dimensioning of security stocks.
Why Artelys Crystal Network Designer?
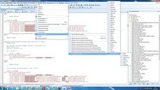
Use of modern computer technologies.
Artelys Crystal Network Designer is a web-based tool that uses the most advanced optimization techniques, as well as reliable and efficient models with an ergonomic interface, offering simple installation and administration tools.
Very high configuration level.
The Artelys Crystal Network Designer can be implemented to respond to any optimization and management problem of logistics networks, regardless of the restrictions and specificities of your business.
Global network optimization.
– Manage the different components of your logical network.
- Multi-installation and multi-mode modeling: supply, production, transportation, distribution, warehouses, customers, etc.
- Modeling requires two flows between the different components of the network: the impact of modifications on all upstream and downstream components to ensure consistency of two flows on the entire network
- I tend to take into account the specificities of your activity: capacity restrictions, production yields, security stocks, contract restrictions, specific characteristics of commodities, etc.
– Optimize your investments and operational decisions.
Optimize your transaction and investment costs to maximize your profits.
Fine modeling of the structure of your network costs: installation and capacity consolidation costs, investment depreciation and inflation, production costs, transformation, transportation and assembly of commodities, commodity receipts, etc.
Simulation and comparison of scenes and/or reproduction of historical data An ergonomic and interactive interface.
– Collaborate easily through a web application.
No installation is necessary on computers for two users thanks to the implementation of the server.
Guaranteed access from different media: computer, tablet and smartphone.
Optimized multi-user management for real-time scenario sharing and team work.
Advanced user management: permissions (reading-recording, only reading, access restricted to viewing, etc.), possible authentication by LDAP.
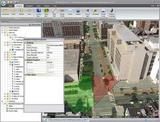
– View and edit your data easily.
Advanced data tables: classification, filter, aggregation.
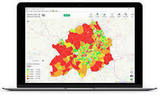
A modular cartographic representation: selection of visualization layers, modification of two data directly on the map, etc.
Automatic data synchronization between different display formats.
– Make the most of your results and analyze them.
Global and detailed indicators specifically adapted to your needs.
Dynamic graphics already configured in the interface.
Easier communication of results with external stakeholders through visualization of dedicated reports.